![]()
The Seeing Math™ Piecewise Linear Grapher was developed to support learning of linear functions through the use of piecewise functions—functions that are described by different rules for different intervals of the domain. Piecewise linear functions help to highlight:
The Seeing Math™ Piecewise Linear Grapher (PLG) provides a real-time, two-way connection between symbolic and graphic representations of piecewise linear functions, so that changes in one representation instantly cause changes in the other. Users can display and modify each interval of a function.
The Grapher lets you enter up to four linear functions and compare the characteristics of each. You can customize the x‑ and y‑axis, and add your own labels. You can also use a built-in tool to capture a screen shot of your work.
The information presented here is designed to familiarize you with all the functionality of the Piecewise Linear Grapher.
Changing a Function (using the graphical representation)
Changing a function (using the symbolic representation)
Making a Function Visible on the Graph
Adding a New Segment to a Piecewise Function
Deleting a Segment from a Piecewise Function
Using the Slider Bar and Motion (or Model) Object
Identifying When Something Is not a Function
The illustration below shows the interface and names of the different areas.
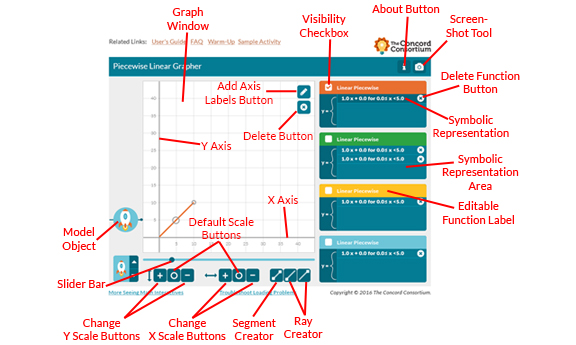
Piecewise Linear Grapher Areas
Each of these areas will be explained in this guide. To use this guide, it helps to have the Piecewise Linear Grapher open. This will make the concepts clearer and allow you to experiment.
When the tool first opens, you see a single orange segment starting at point (0,0) and continuing to the right and up until it reaches point (5,5).
At the upper right, you see a piecewise function with a single symbolic expression. Notice how the symbolic expression matches the locations of the ends of the orange segment. If you move the line the numbers will change. If you change the numbers, the line will move.
All functions are represented both symbolically and graphically in the Piecewise Linear Grapher.
You can move both line segments and rays in the Graph Window. (Their symbolic expressions change accordingly.)
Click on it to select it. A selected line segment displays "handles" at each end.
Click and drag in the center of the ray to move it. The slope and length will not change.
A ray has only one "handle." The other end (an orange arrow which may be hidden) goes off screen to infinity.
Note The slope of a ray can only be modified using the symbolic expression of the ray.
You can change the symbolic expression of a function. (The line segment or ray also changes accordingly.)
To change the function numbers, click once on the Symbolic Expression. The Edit Segment dialog box opens:
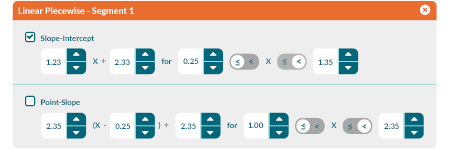
Edit Segment Dialog Box
You can choose either a Point-Intercept Form or a Point-Slope Form by clicking the tabs.
1. Click in any of the squares with numbers to select them (they are blue when selected).
2. Use the up and down arrows on the right side to change the number.
Changes in the numbers will be reflected in the line segment or ray.
3. When you finish, you can close the dialog box by clicking on the X in the box's upper right corner.
To compare the visual representations of two or more functions in the graph window, you must make them visible on the graph.
To make a function visible on the graph, click its Visibility Checkbox. (A check mark appears, showing that the function is now visible on the graph.)
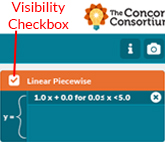
Location of the Visibility Checkbox
To add a new segment to a piecewise function, you must use the Graph Window. You can create as many segments or rays as you wish.
• If there are no line segments or rays currently in the Graph Window, click first in the symbolic function area. Then click the segment creator or ray creator.
The new segment or ray is created at the origin.
• If there is a segment or ray currently in the Graph Window, click the segment or ray you want to add to (or click its symbolic function area). Then click the segment creator or ray creator.
A new segment or ray is added to the highest point of a selected segment, or to the end point of a selected ray.
Segment and Ray Creator Buttons |
The Ray Creator on the left creates a ray approaching positive infinity. The one on the right creates a ray approaching negative infinity. Each of these is created off of the highest or lowest point of an existing function. |
When you add a new segment or ray, its symbolic representation also appears in the symbolic representation area.
Once you have created a new function by adding rays or segments in the Graph Window, you can modify it as described above in Changing a Function.
Use the Delete button to remove any selected ray or line segment. (This also removes the corresponding symbolic expression.)
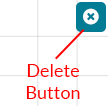
The Delete Button
To create a new function when there are no symbolic representations in the Function Area, click the Visibility Checkbox, and then click the Segment Creator or Ray Creator.
You may want to change the scale or axis labels to suit a particular visualization or problem. |
|
Change Scale and Axis Labels Buttons |
• To zoom in along the x-axis or y-axis, click the respective zoom in button.
• To set the graph to default zoom level along the x-axis or y-axis, click the respective default zoom button.
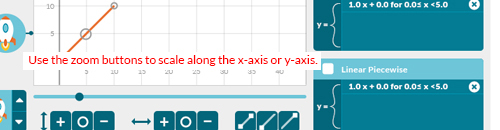
Graph Window with X Scale Change Indicated
• To zoom out along the x-axis or y-axis, click the respective zoom out button.
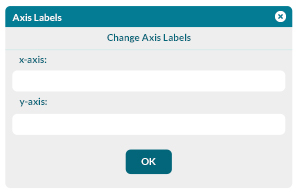
To add or change the labels for either axis:
|
|
The Change Axis Labels Dialog Box |
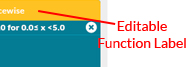
You may wish to add custom labels to the different functions in order to more clearly see which function represents what. For instance, if you were comparing functions representing three phone company offers, you could label the three functions with the names of the companies.
To customize the labels:
1. Click in the Editable Label box over the function.
2. Highlight the existing label, "Linear Piecewise."
3. Type your new label.
|
The Editable Label Field |
The Screenshot button allows you to save an image of your graph and its functions. To do this:
1. Click the Screenshot button (a picture of a camera in the upper right corner).
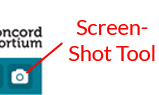
The Screenshot Button
A dialog box opens that looks like the following:
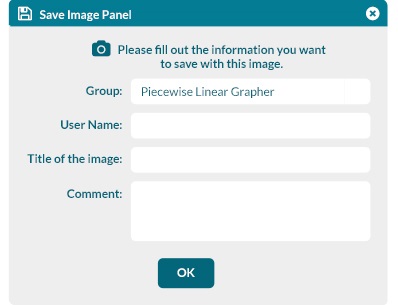
The Screenshot Dialog Box
2. Fill in the fields and click OK.
Another dialog box opens, with a web address where you can view your image.
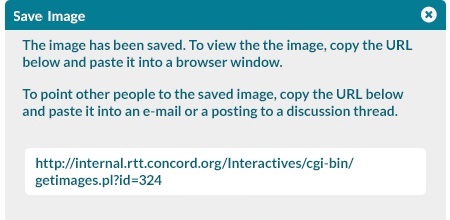
Dialog Box Showing Web Address of Image
3. Copy and paste this address into your web browser to view your image. (Note that your address will be different from this example.)
4. When you are finished, Click on Close button to close the dialog box.
Note To save a copy of your image to your own computer (for example, to have available even when you are not on the Internet), first view the image in a web browser, then right-click on a PC or control-click on a Mac and choose "Save Picture As…." Save the image with a name that you can remember. (Don't use the default "getimage.gif" name as you may over-write previously saved images.)
If you are in an Seeing Math™ course and would like to share your image in the discussion boards, follow the directions under Technical Help, How to Share an Image from an Interactive.
Under the Graph Window is a slider bar and slider. (The slider resembles a circle.)
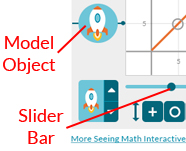
The Slider Bar, Slider, and Motion (or Model) Object
This is most useful for comparing more than one function and noting the different rates of change.
Note At any position of the slider, if there is no value defined, the trace and object will not be visible.
Click the icon selector to choose your new icon from the collection offered.
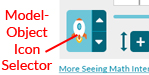
Model Object Icon Selector
The Piecewise Linear Grapher allows you to create continuous or discontinuous functions. But you might accidentally create something that is not a function. In that case, when you move the slider, you will see an alert message:
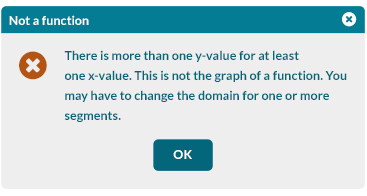
Alert Message Indicating That Something Is not a Function